riskyC1
A five-stage pipelined RISC-V CPU, designed from the spec sheet up and verified on a Spartan-7 FPGA
Ever since I built my own PC at 13 years old, I've wanted to design my own CPU. After learning about RTL design in my courses, I decided it was time to make that dream come true. riskyC1 is a five-stage pipelined RV32I core that I designed straight from the ISA spec over 13 days of logged work, then brought up on a Spartan-7 FPGA board. It passes all 38 official rv32ui tests on real hardware, runs at 70 MHz, and I can account for pretty much every lost cycle. It also became the starting point for the cores on our tapeout.
Getting Started
Instead of jumping straight into the CPU, I wanted to see if I could get a basic program to work on the board. After becoming familiar with the Vivado toolchain (RTL → synthesis → implementation → bitstream → JTAG), I decided I would document each decision in a devlog to deepen my understanding, which can be found on the repo. I also bought Digital Design and Computer Architecture: RISC-V Edition by Harris and Harris, which has been very helpful throughout the project.
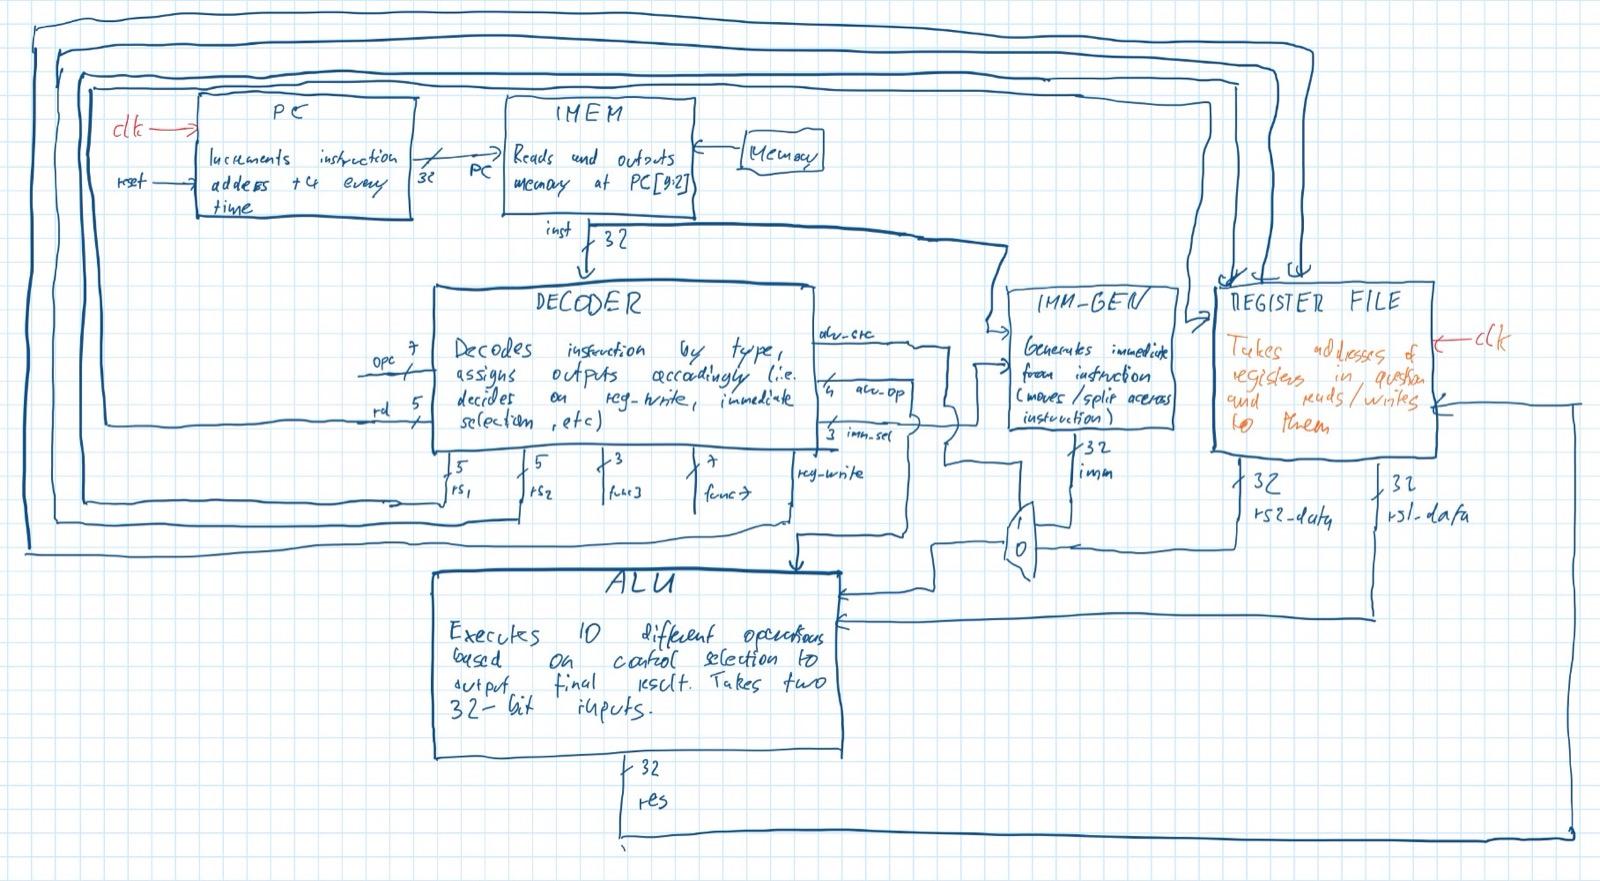
After that, I built the core one block at a time, each with its own self-checking testbench: register file, ALU, immediate generator and decoder. The bugs here were mostly the classic ones, like mixing up SRA and SRL on 0xFFFFFFF0, SLT vs SLTU on −1 < 1, and an S-type immediate sign-extended with {19{}} instead of {20{}}, which only showed up once I tested a negative immediate.
Breaking it on purpose
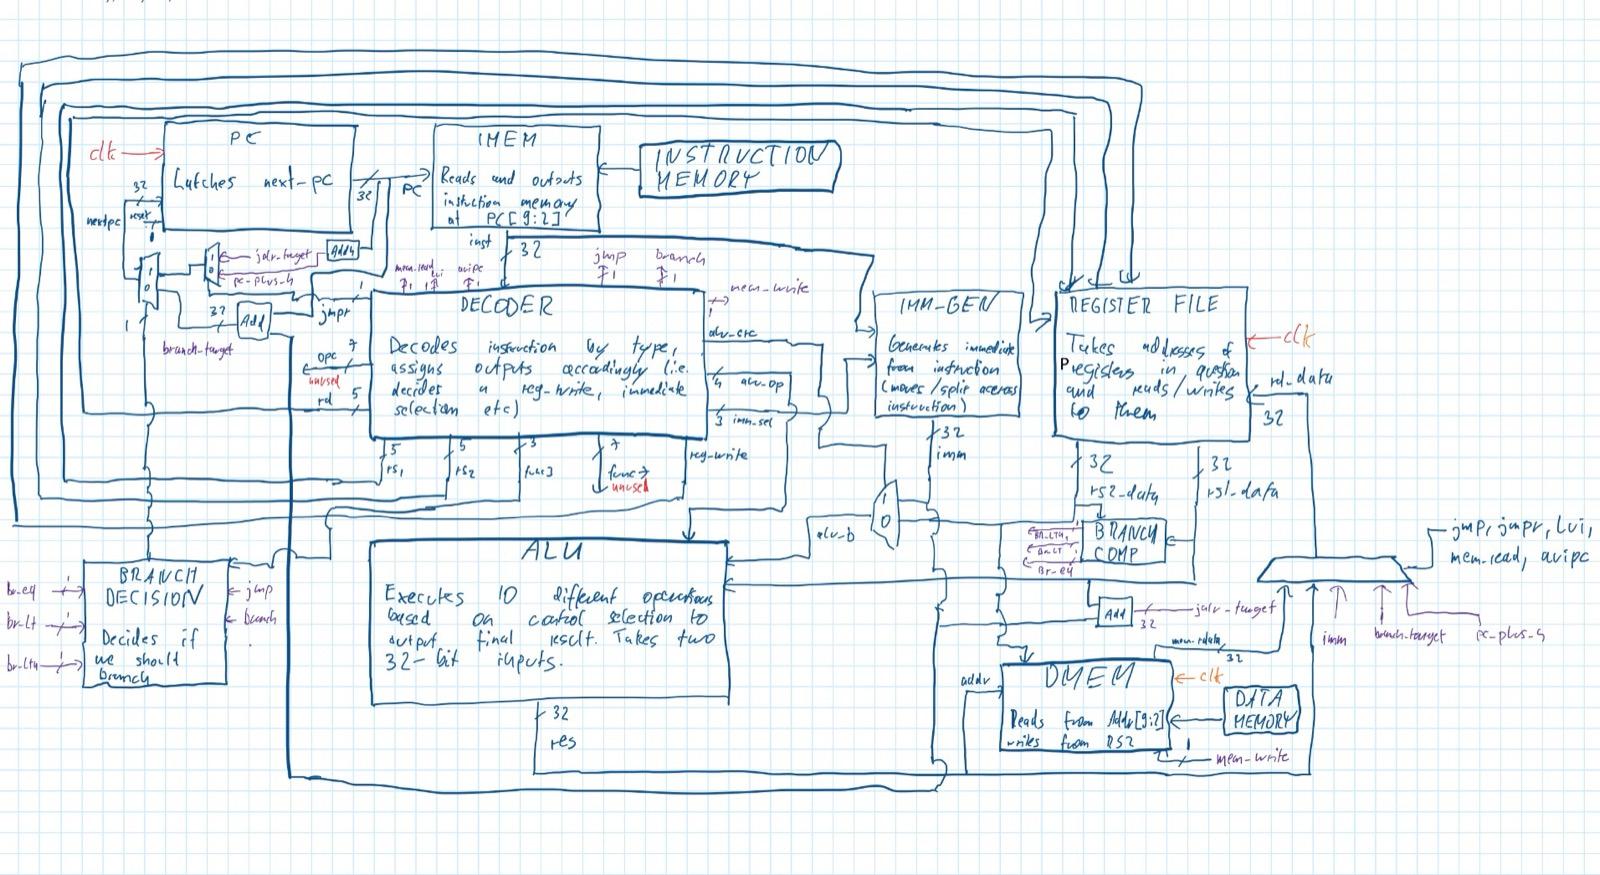
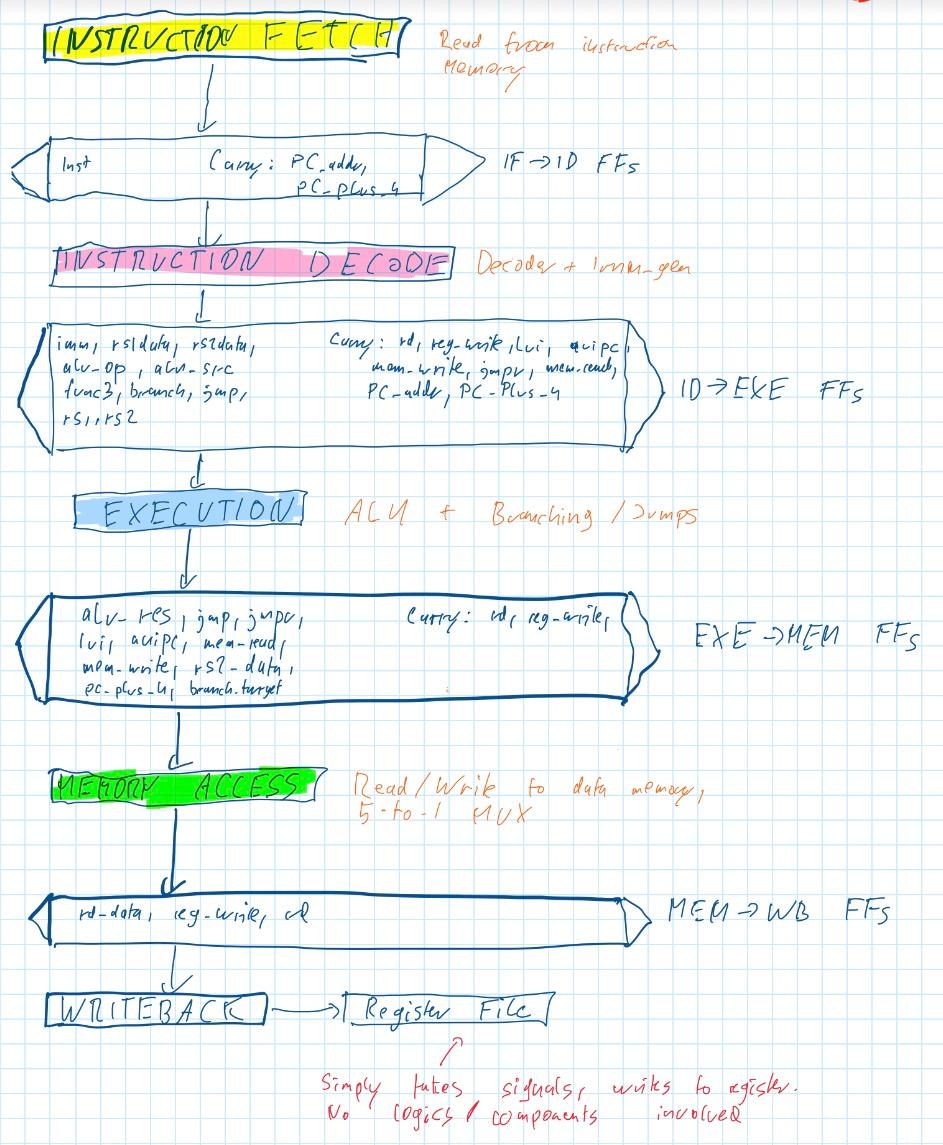
Once the single-cycle core passed all 16 of my regression checks, I split it into five stages with no hazard handling at all. As expected, a lot of things broke with only 11/16 tests passing, but I thought that fixing them would be the best way to understand the architecture on a deeper level.
The failures:
- Write-first register file. If an instruction in ID reads a register in the same cycle that WB writes it, it should see the new value. This was a one-line fix and removed the distance-3 hazard.
- Forwarding. A forwarding unit in EX compares the source registers against whatever MEM and WB are about to write, with MEM taking priority if both match. This got me to 15/16.
- Branch flush. Branches resolve in EX, so a taken branch has to kill the two instructions behind it by resetting the IF/ID and ID/EX registers. 16/16.
Interestingly, the load-use test passed even though I expected it to fail. After some digging, it turned out this wasn't luck: dmem reads combinationally, and I had moved the writeback mux into MEM to save about 165 flip-flops. Together, that means a loaded value can be forwarded in the same cycle without a stall. I decided to keep it, and added a regression test that fails if anyone ever registers the dmem read.
step through the pipeline
Nothing in flight yet. One instruction enters IF per cycle.
| instruction | ||||||||||||
|---|---|---|---|---|---|---|---|---|---|---|---|---|
| addi x1, x0, 5 | IF | |||||||||||
| addi x2, x1, 3 | ||||||||||||
| lw x3, 0(x2) | ||||||||||||
| add x4, x3, x1 | ||||||||||||
| beq x4, x4, +12 | ||||||||||||
| sub x5, x1, x2 | ||||||||||||
| or x6, x1, x2 | ||||||||||||
| sw x4, 4(x0) |
An 8-instruction program that hits every hazard path: MEM→EX forwarding, the write-first register file, the stall-free load-use and a taken branch flushing two slots.
// forwarding unit: does EX read a register MEM or WB is about to write?
always_comb begin
    fwd_a = 2'b00;
    if (mem_reg_write && (mem_rd != 5'd0) && (mem_rd == exe_rs1))
        fwd_a = 2'b01;                                  // MEM is newer
    else if (wb_reg_write && (wb_rd != 5'd0) && (wb_rd == exe_rs1))
        fwd_a = 2'b10;

    fwd_b = 2'b00;
    if (mem_reg_write && (mem_rd != 5'd0) && (mem_rd == exe_rs2))
        fwd_b = 2'b01;
    else if (wb_reg_write && (wb_rd != 5'd0) && (wb_rd == exe_rs2))
        fwd_b = 2'b10;
end

always_comb begin
    case (fwd_a)
        2'b01:   data_fwd_a = mem_wb_data;
        2'b10:   data_fwd_a = wb_data;
        default: data_fwd_a = exe_rs1_data;
    endcase
end
The forwarding unit. The forwarded value is the already-resolved writeback data, so jal return addresses and lui values get forwarded correctly too.
Measuring Real Timing & Utilization
After completing the design, I was super excited to test my core on an FPGA and get some real numbers. I was very into overclocking at some point, so optimizing the data path for max frequency was the part I was most excited about. However, even after adding the UART, utilization reports showed 274 LUTs for the entire pipelined CPU, which seemed very suspicious.
After some research, I concluded that Vivado had essentially optimized my entire core away. Because the design had no output ports, Vivado simply pruned most of it. Even worse, since I was baking in test programs using $readmemh, Vivado constant-folded the whole CPU into a circuit that computes the result of that one program. The instruction memory had simply turned into a 257-input constant mux.
To fix this, I built a hardware UART bootloader: you send in a word count followed by the data, and it writes it into memory while holding the core in reset (the same system used later in the tapeout project). Since the program is now unknown at synthesis time, the numbers became honest (1,120 LUTs at that point). As a bonus, I could now stream all 38 ISA tests back-to-back without a reset.
Around the same time, I also found a real bug that my 18-check suite had missed: the branch comparator was using unforwarded operands, so a bne right after a lw of the UART busy flag resolved incorrectly and dropped bytes.
Bring-up and the official tests
Before finally receiving the first "Hello world" over serial, I encountered a variety of other bugs, which cost me an extra few days to resolve. Most notably, TX and RX were swapped (Digilent names the pins from the USB bridge's point of view), the UART baud divider had a hard-coded 100 MHz in it, and an open COM port blocked JTAG, since one FTDI chip handles both.
For the official riscv-tests, I wrote a custom riscv_test.h that reports P or F<testnum> over the UART, since the core has no CSRs.
The final result: 38 passed, 0 failed, 0 no response, on real hardware.
Where the performance goes
To see where the cycles were going, I added cycle and instructions-retired counters (memory-mapped, since there are no CSRs) and wrote a benchmark where I could predict the answer in advance: 2,000 instructions with 199 taken branches. My prediction was 2,000 + 199 × 2 = 2,398 cycles, and the measured result was 2,403. The five extra cycles are just the pipeline filling up.
Adding byte and halfword loads and stores cost me about 20 MHz, since the byte lanes pushed dmem into distributed LUTRAM. The timing wall at 70 MHz also wasn't where I expected it. The critical path turned out to be the branch redirect, not the MEM chain, and about 70% of it is wire delay from a flush net with a fanout of 256. I tried max_fanout (ignored, since the loads are reset pins) and control-set optimization (which made it worse). A true fix would be resolving branches in ID, which I considered, but it would be a lot of extra work. Architectural optimizations to make the core faster are still something I very much want to do, but I currently don't have the time to look into them properly.
where the cycles (and nanoseconds) go
The slow path isn't the MEM chain I expected. It's the branch redirect: mem_alu_result → PC and the flush net that fans out to 256 reset pins. ~70% of it is routing.
Future work: a faster clock, CSRs, traps, interrupts and the M extension. In the meantime, a multicycle version of this core (Bob) is going onto our chip.